Data visualization involves presenting information in graphical forms such as charts, graphs, and maps to make trends, outliers, and patterns in data more accessible. Executives and managers often seek effective ways to visualize data for valuable insights. One widely-used and open-source data visualization library is ChartJS, offering a simple yet flexible solution for JavaScript charting designed for both developers and designers.
This blog explores how to utilize ChartJS within a Lightning Web Component (LWC) to create compelling visualizations. The demonstration involves extracting data from a Salesforce object using Apex, feeding it into a bar chart. Additionally, an aggregate query is employed to consolidate the data into two datasets. The user interface is constructed using two LWCs—one serving as the parent and the other as its child.
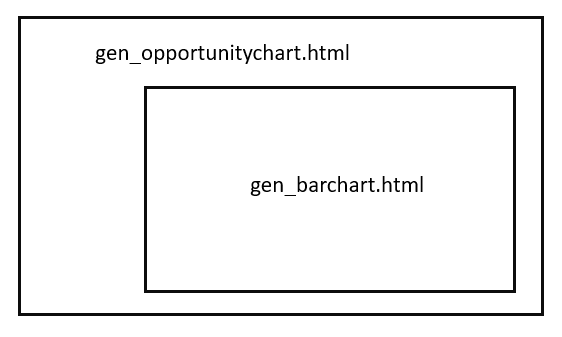
The majority of data processing will be managed by the parent component, which will then pass it as an attribute (chartConfiguration) to the child. This blog focuses on presenting an Opportunity Bar Chart featuring Expected Revenue and Amount for various stages.
Begin by downloading the ChartJS file from this location and loading it as a static resource with the name ‘ChartJS’. Subsequently, create a Lightning Web Component named ‘gen_barchart’ and copy the provided code below.
gen_barchart.js
import { LightningElement, api } from 'lwc';
import chartjs from '@salesforce/resourceUrl/ChartJs';
import { loadScript } from 'lightning/platformResourceLoader';
import { ShowToastEvent } from 'lightning/platformShowToastEvent';

export default class Gen_barchart extends LightningElement {
    @api chartConfig;

    isChartJsInitialized;
    renderedCallback() {
        if (this.isChartJsInitialized) {
            return;
        }
        // load chartjs from the static resource
        Promise.all([loadScript(this, chartjs)])
            .then(() => {
                this.isChartJsInitialized = true;
                const ctx = this.template.querySelector('canvas.barChart').getContext('2d');
                this.chart = new window.Chart(ctx, JSON.parse(JSON.stringify(this.chartConfig)));
            })
            .catch(error => {
                this.dispatchEvent(
                    new ShowToastEvent({
                        title: 'Error loading Chart',
                        message: error.message,
                        variant: 'error',
                    })
                );
            });
    }
}
I have used platformResourceLoader to load the script from the static resource on a renderedCallback() lifecycle hook.
gen_barchart.html
<template>
    <div class="slds-p-around_small slds-grid slds-grid--vertical-align-center slds-grid--align-center">
        <canvas class="barChart" lwc:dom="manual"></canvas>
        <div if:false={isChartJsInitialized} class="slds-col--padded slds-size--1-of-1">
            <lightning-spinner alternative-text="Loading" size="medium" variant="base"></lightning-spinner>
        </div>
    </div>
</template>
In the HTML I have added a canvas tag, as per the ChartJS documentation the Chartjs library uses that canvas to draw the chart.
3. Create an apex class to pull the data from salesforce. In this example I’ve used a SOQL to pull data from Opportunity and aggregated the the Amount and ExpectedRevenue field.
GEN_ChartController.cls
public class GEN_ChartController {
    @AuraEnabled(cacheable=true)
    public static List<AggregateResult> getOpportunities(){
        return [SELECT SUM(ExpectedRevenue) expectRevenue, SUM(Amount) amount, StageName stage
               FROM Opportunity WHERE StageName NOT IN ('Closed Won') GROUP BY StageName LIMIT 20];
    }
}
4. Create another LWC as the parent that does the data work for us.
gen_opportunitychart.js
import { LightningElement, wire } from 'lwc';
import getOpportunities from '@salesforce/apex/GEN_ChartController.getOpportunities';

export default class Gen_opportunitychart extends LightningElement {
    chartConfiguration;

    @wire(getOpportunities)
    getOpportunities({ error, data }) {
        if (error) {
            this.error = error;
            this.chartConfiguration = undefined;
        } else if (data) {
            let chartAmtData = [];
            let chartRevData = [];
            let chartLabel = [];
            data.forEach(opp => {
                chartAmtData.push(opp.amount);
                chartRevData.push(opp.expectRevenue);
                chartLabel.push(opp.stage);
            });

            this.chartConfiguration = {
                type: 'bar',
                data: {
                    datasets: [{
                            label: 'Amount',
                            backgroundColor: "green",
                            data: chartAmtData,
                        },
                        {
                            label: 'Expected Revenue',
                            backgroundColor: "orange",
                            data: chartRevData,
                        },
                    ],
                    labels: chartLabel,
                },
                options: {},
            };
            console.log('data => ', data);
            this.error = undefined;
        }
    }
}
From the above block of code, you can see the multiple elements in the dataset. This is how you keep adding dataset to show on the chart. The chartconfiguration as provided here defines the type of chart, data, labels and any options.
gen_opportunitychart.html
<template>
    <lightning-card title="Open Opportunities" icon-name="utility:chart">
        <template if:true={chartConfiguration}>
            <c-gen_barchart chart-config={chartConfiguration}></c-gen_barchart>
        </template>
</lightning-card>
</template>
gen_opportunitychart.js-meta.xml
?xml version="1.0" encoding="UTF-8"?>
<LightningComponentBundle xmlns="http://soap.sforce.com/2006/04/metadata">
    <apiVersion>50.0</apiVersion>
    <isExposed>true</isExposed>
    <targets>
        <target>lightning__Tab</target>asasas
        <target>lightning__AppPage</target>
    </targets>
</LightningComponentBundle>
5. Create a Lightning App page to preview the chart.
The chart will be rendered as shown below:

Retrieve the files from the GitHub repository available at this link.