The Apex debug logs encompass a vast array of data, including database operations, system processes, code execution within managed packages, transactional errors, as well as initiated flows and process builders.
The Apex debug logs provide extensive information, encompassing database operations, system processes, code execution within managed packages, transactional errors, initiated flows, and process builders. This comprehensive data is immensely beneficial for addressing performance issues, diagnosing bugs, or comprehending code behavior during process initiation. Yet, comprehending the raw log content alone can be challenging.
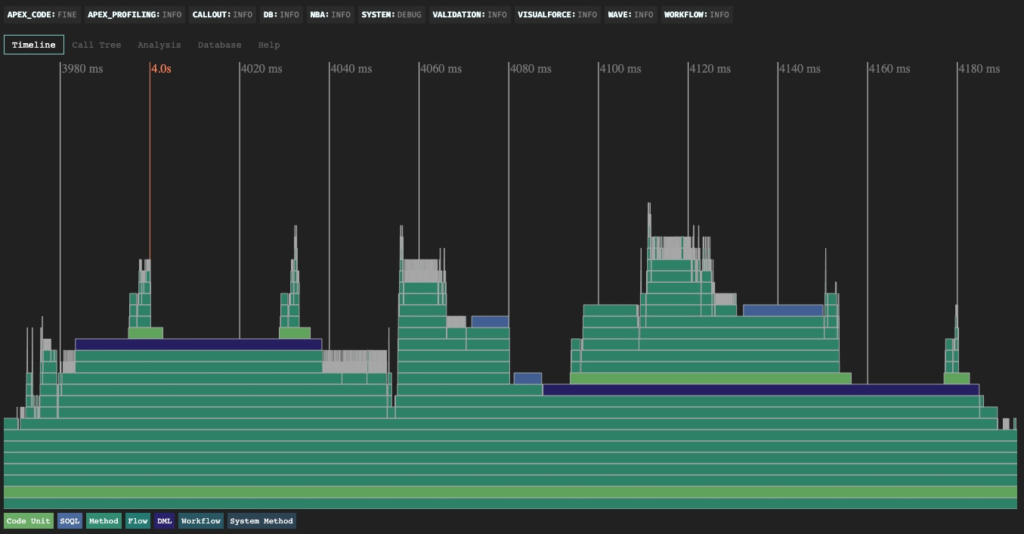
The Apex Log Analyzer presents debug log details in a flame graph view within the Timeline tab, offering an excellent visualization of the call tree’s structure, duration of each method or statement, and the integration of managed packages and flows. This tool facilitates the swift identification of code areas consuming the most execution time and the pinpointing of problematic sections.
In addition to the Timeline tab, the Apex Log Analyzer comprises three other tabs with valuable insights:
- Call Tree tab: illustrates method calls
- Analysis tab: presents a performance summary of methods
- Database tab: provides a breakdown of contained DML and SOQL queries
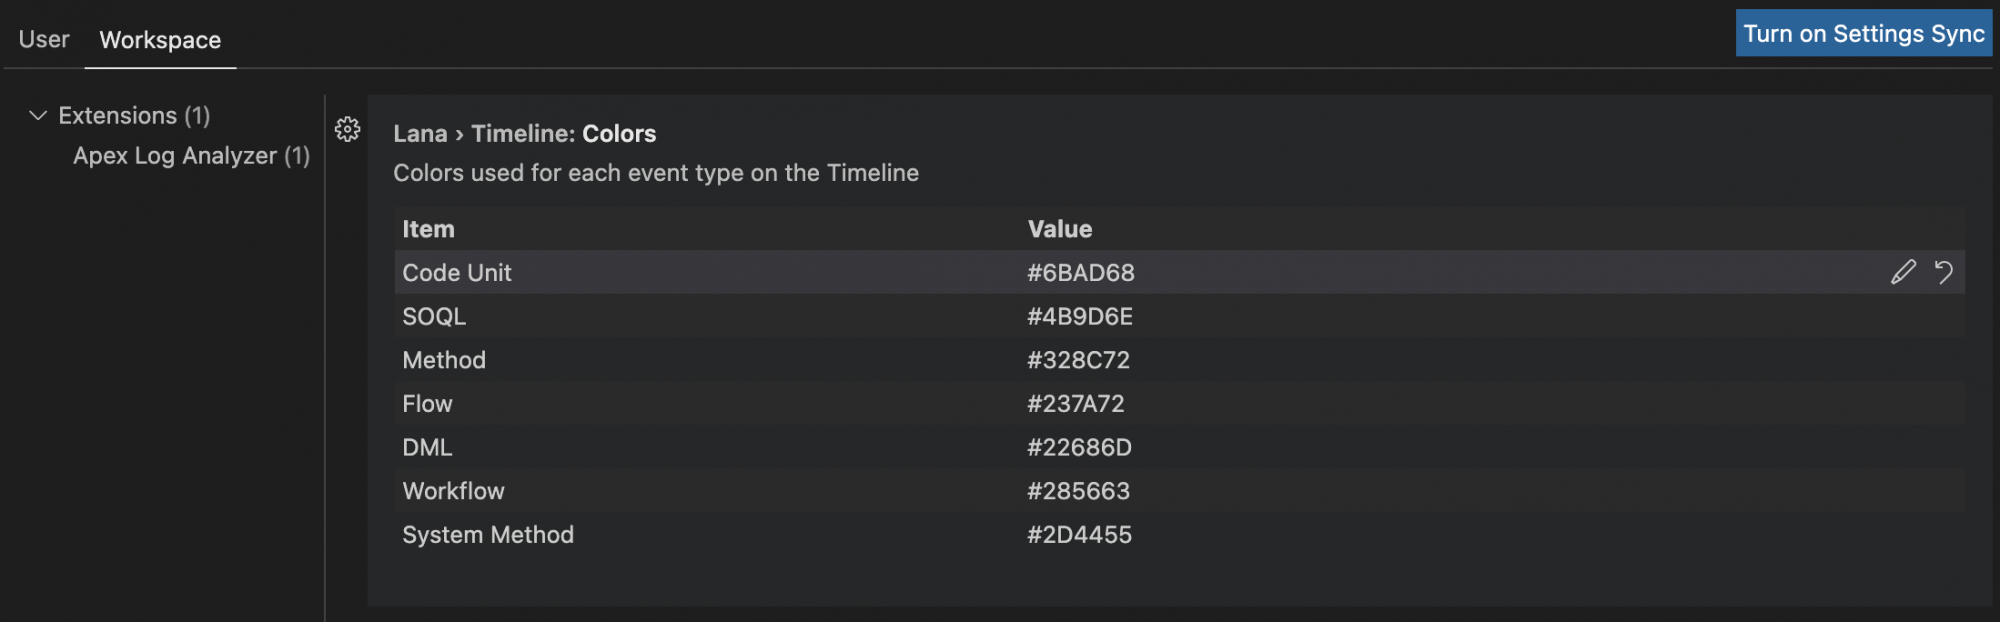
The tool allows you to pick your own colors. Just go to the settings UI within the IDE and search for “Apex Log Analyzer Colors.”
What are the latest additions in version 1.5.0
We’ve been diligently enhancing the Apex Log Analyzer based on community requests and feedback from FinancialForce developers. Here’s what’s included in v1.5.0:
Enhanced Zoom Feature:
To address the challenge of navigating through small method calls within busy timeline sections, we’ve introduced a precise zoom option with an accuracy of 0.001ms. This feature enables seamless zooming in and out using mouse controls, including scroll and drag functionalities in both vertical and horizontal directions.
Improved Speed and Expanded Event Types:
Recognizing the inconvenience of handling extensive logs, we’ve optimized the log viewer to swiftly open, parse, and display timelines. Additionally, we’ve expanded support for numerous event types, meticulously reviewing debug logs and documentation. If you encounter any missing or improperly functioning types, please notify us by raising an issue on our GitHub repository.
Database Navigation Enhancement:
While the Database tab previously displayed all SOQL and DML activities, we’ve now incorporated the call tree for each query. This enhancement enables quicker navigation to the line in the class where the SOQL was executed, facilitating faster handling of queries exceeding anticipated row counts—provided the code is locally available.