
How to Step-by-Step Debug Salesforce APEX Code with a Breakpoint in VS Code?
In contemporary languages and integrated development environments (IDEs) like IntelliJ, VS Code, and Eclipse, debugging code in a step-by-step fashion is achieved by setting breakpoints, launching the server/application, and proceeding with debugging.
However, this process is typically feasible when the runtime environment is on your local machine. In the case of Salesforce, the runtime environment is in the cloud.
Thankfully, Salesforce offers a method to debug your Apex code. Let’s explore it!
Code for Apex Debugging
Imagine you’re calling the following code from an Apex Trigger on the Opportunity Trigger.
Code throwing an unexpected Exception
public with sharing class ClassWithABug {
    public static void methodToDebug(List<Opportunity> opporunityList){
        for(Opportunity loopOpportunity : opporunityList){
            Boolean throwException = false;
            throwException = loopOpportunity.Name.startsWith('A');
            throwException = throwException && loopOpportunity.Amount > 500;
            if(throwException){
                throw new ToDebugException('You will never fix me :-)');
            }
        }
    }
    public class ToDebugException extends Exception{
    }
}
This code generates an exception when the Opportunity’s Name begins with an ‘A’, and the amount exceeds 500.
Before proceeding, it’s crucial to note that this process doesn’t involve live debugging. Instead, you will:
- Set a breakpoint.
- Perform the necessary actions in Salesforce to trigger your code.
- Retrieve the logs locally.
- Replay the sequence of events in the code based on the information present in the retrieved logs.
It’s essential to recognize that, unlike Java, there are fewer possibilities, such as modifying variable contents, in this debugging process.
Now, let’s delve into the details!
Set your breakpoint/checkpoint on Salesforce.
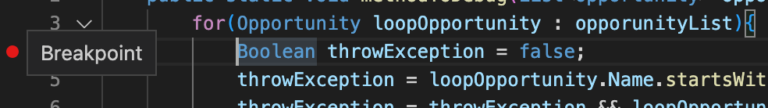
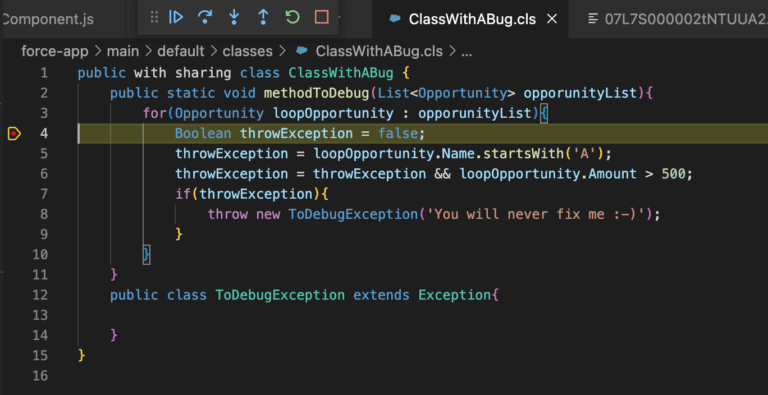
Click on the left of the line numbers on the line you want to start your debug on. For my Example, I put the breakpoint on the 4th line
Now that you’ve added the breakpoint/checkpoint, it’s time to include it in your organization.
Press CTRL + SHIFT + P, type: “SFDX: Update Checkpoints in Org,” and select it.
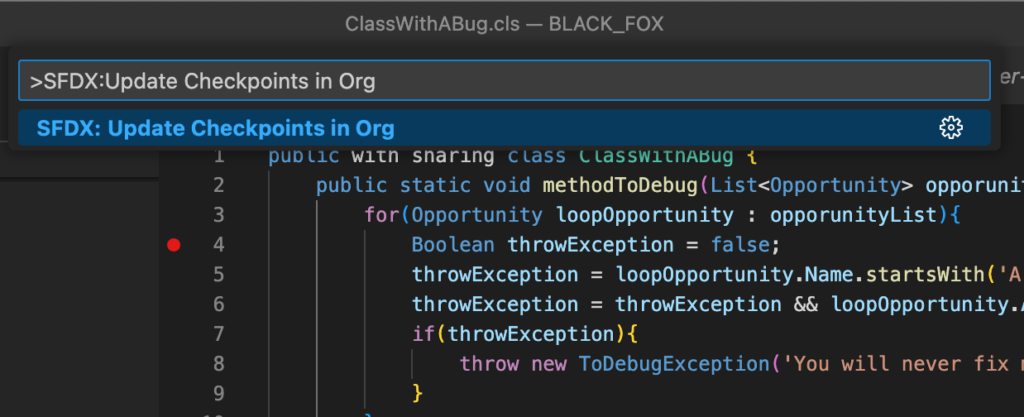
Include breakpoints in the Salesforce org
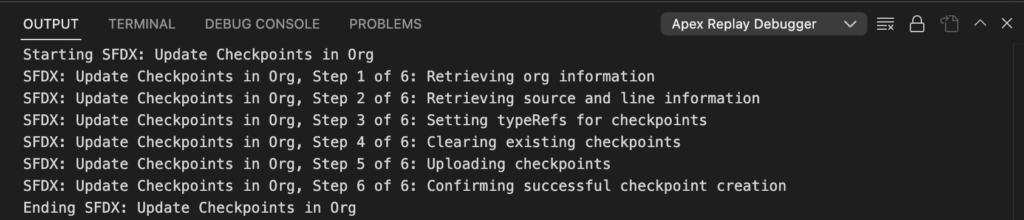
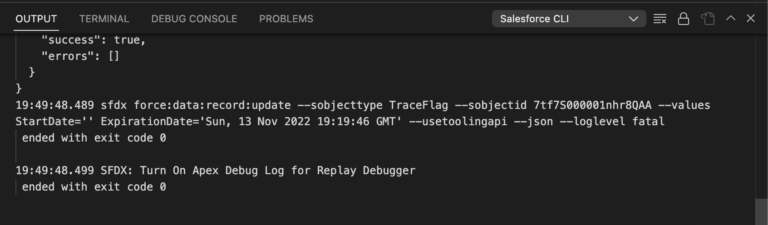
and await confirmation in the terminal that the breakpoint/checkpoint has been added:
Enable Apex Debug mode in the Salesforce org.
Now, it’s time to activate the Debug mode on your Salesforce org! Please be aware that this session will be accessible for only 30 minutes.Press CTRL + SHIFT + P in VS Code, type: “SFDX: Turn On Apex Debug Log for Replay Debugger,” and press Enter.
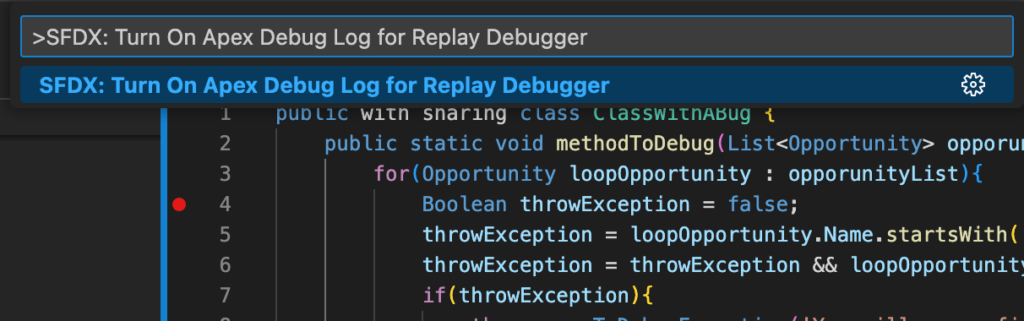
Tur on Apex debug logs
Wait for the confirmation
Execute the code in the Salesforce org.
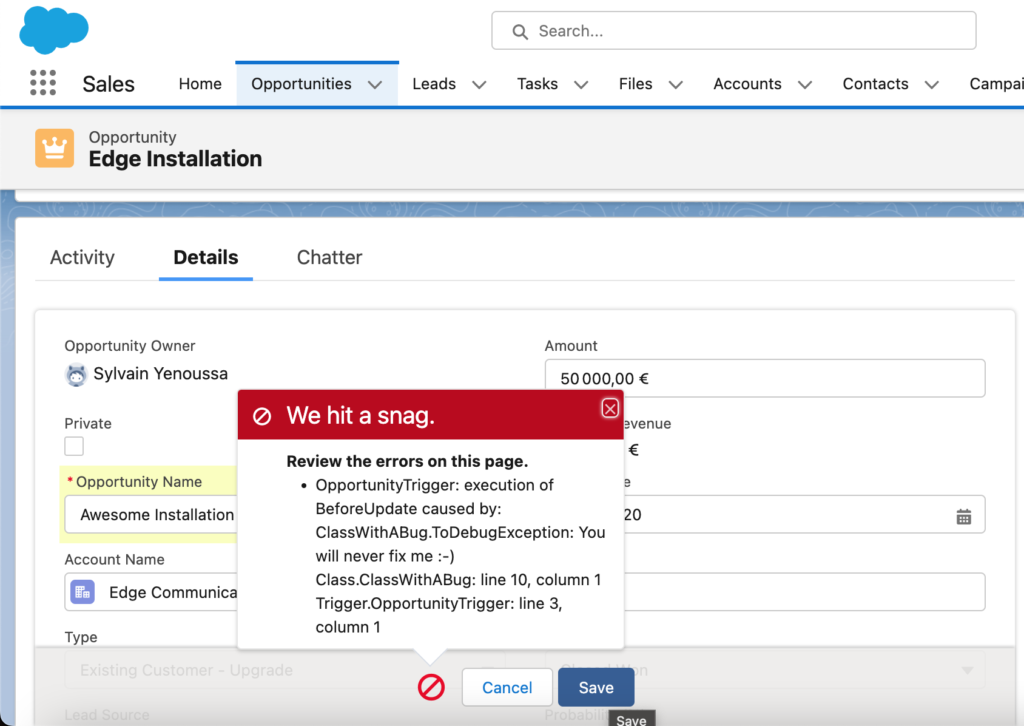
In my case, all I need to do is save an Opportunity record with a Name starting with “A” and an Amount greater than 500.
As anticipated, I receive the error, indicating that the code I intend to debug has been executed. Now, it’s time to proceed with retrieving the corresponding log and replaying it in VS Code!
Fetch the Apex debug log to your local environment.
Now that I have confirmation that the code has been executed correctly, let’s retrieve it locally.
It’s a straightforward process:
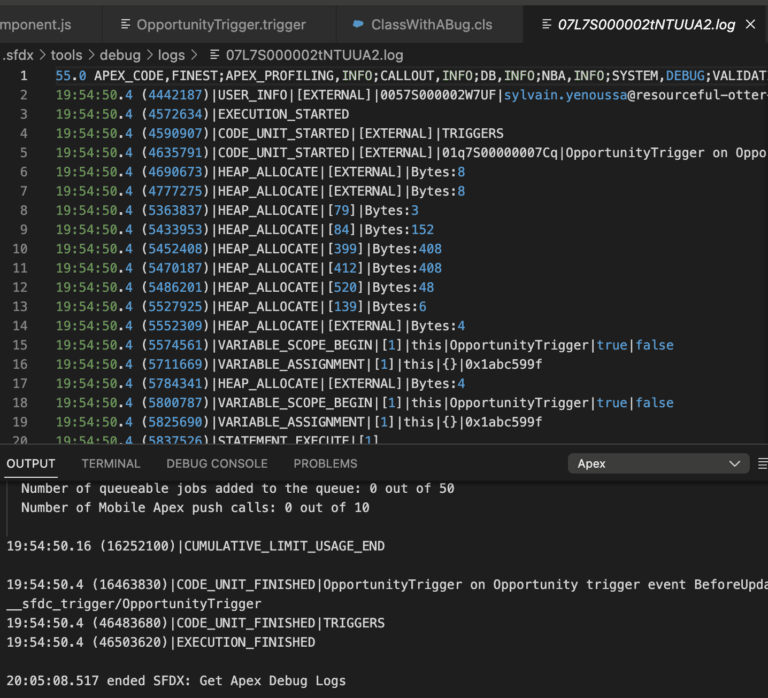
- Press CTRL + SHIFT + P and type: “SFDX: Get Apex Debug Logs.”
- In the next prompt, select the debug log that has been created. Note: this may be tricky if multiple developers are working.
- After a brief moment, you’ll have the debug logs locally in VS Code. This debug log encompasses all the information needed to replay the actions that occurred in the Sandbox within VS Code.
Apex replay logs
Initiate the replay of the Apex code.
It’s time! In the Apex Debug log you just retrieved, right click anywhere in the log file and select SFDX: Launch Apex Replay Debugger with Current File.
You’ll see your VS Code turn into the debug mode:
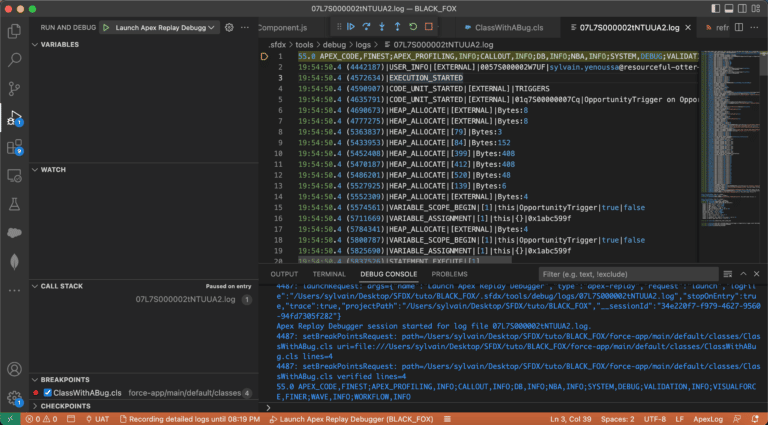
lick on the Continue button on the toolbar that appeared above.
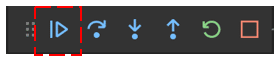
It will start the debug directly where you have put the breakpoint/checkpoint in your code!
Now that you have started to debug, use the toolbar (or the associated shortcut) to move in the replay.
- Step over: goes to the next line of code
- Step Into: goes to the next line of code. But id the current line is calling an Apex method, it will go INTO the method
- Step out: if you entered a method with the above “step Into”, it will allow you to resume the method call and go back to the step AFTER you entered into the method
Apex debugger
As you can see in the left panel, while you move forward in the execution of you Salesforce Apex code, the variable values are available and you can see the associated values as you progress. This is awesome to understand the behavior of your code !
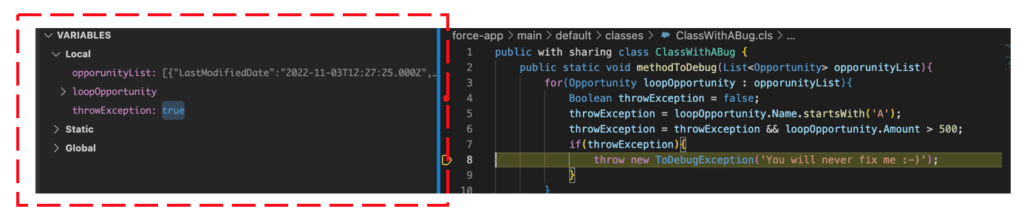
VS Code Apex debugger view
Summary:
Let’s summarize the steps to achieve this:
- Select a breakpoint in VS Code.Press CTRL + SHIFT + P: “SFDX: Update Checkpoints in Org” to set the breakpoint in the Salesforce org.Press CTRL + SHIFT + P: “SFDX: Turn On Apex Debug Log for Replay Debugger” to enable debugging for 30 minutes.Execute the Apex code as needed.Press CTRL + SHIFT + P: “SFDX: Get Apex Debug Logs” to retrieve the appropriate debug file.Right-click on the file and select: “SFDX: Launch Apex Replay Debugger with Current File” in the list.Click on Continue.
It’s incredibly straightforward. Remember to remove the breakpoint afterward (if I recall correctly, a Salesforce org can handle only a limited number of breakpoints).Be aware of some limitations. Since it’s only a replay, you can’t change the value of variables, and certain limitations listed at this link, such as being unable to debug scheduled Apex, should be taken into account.