The situation or the context.
During work on a requirement for an Automotive sector project for a client located in Dallas, Texas, the need arose to dynamically open the record page in a new tab upon clicking on scatter chart points/dots within a VF page using ChartJS.
The difficulty or the obstacle.
Even though standard apex:chart tags were available for chart representation, the necessity for this requirement led us to opt for ChartJS. We leveraged ChartJS functionalities to craft custom logic, enabling the opening of multiple record pages in a new tab upon clicking data points.
The method or the strategy employed.
We’ve utilized the Apex controller to dynamically fetch and exhibit data via a VF Page. In this scenario, we’re utilizing the Amount and Month fields from the Account Standard object. The Month field serves as the X-Axis data, while the Amount field represents the Y-Axis data. Here’s an example.
Illustration:
In this instance, an Apex controller titled ‘ChartDataExample’ is crafted to retrieve data for chart plotting and subsequent display on the VF Page ‘ScatterChart’.
Step 1: Apex Controller Creation.
public class ChartDataExample {

    public string accString {get;set;}

    public ChartDataExample(){

	 //fetching data from the Account object to display
        public List<Account> accList = [select id,Name,Month__c,Amount__c from Account where Month__c != Null and Amount__c !=Null];

	//serializing the fetched data into json
	accString = json.serialize(accList);
    }
}
Step 2: Generate a Visualforce Page.
<apex:page showHeader="true" sidebar="false" id="page" docType="html-5.0" controller="ChartDataExample">
<html>
<head>
    <meta charset="utf-8"/>
    <title>Chart.js demo</title>

    <!--Import ChartJs Script-->
    <script src="https://cdn.jsdelivr.net/npm/chart.js"></script>

</head>
<body>
    <h1>Chart.js Scatter Chart </h1>
     <div style="position: relative; height:40vh; width:80vw">

     <!--Name of the canvas 'myChart',on which the chart will be drawn-->
     <canvas id="myChart"></canvas>
     </div>
     <script>

       //define variables
       var accData = '{!accString}';
       var accFinalData = JSON.parse(accData);

       //Array where data will be pushed
       var chartData = [];
       for (var i = 0; i < accFinalData.length; i++) {
            chartData.push({ x: accFinalData[i].Month__c, y: accFinalData[i].Amount__c });
       }

        var canvasP = document.getElementById("myChart");
        var ctx= document.getElementById("myChart").getContext("2d");
        var newChart = new Chart(ctx, {
        type: 'scatter',
        data: {
            datasets: [{
                label: 'Scatter Dataset',
                backgroundColor: 'green',
                data: wonData
            }]
        },
        options: {
            scales: {
                x: {
                    type: 'linear',
                    position: 'bottom',
                     grace: '5%'
                }
            }
        }
    });
    canvasP.onclick = function(e) {
        const points = newChart.getElementsAtEventForMode(e, 'nearest', { intersect: true }, true);
        //variable 'points' will store the item that was clicked on.

	let matchedIds = [];
        //run a loop for clicked points
        for(let i=0; i<points.length;i++){
                let month = points[i].element.$context.raw.x;
                let amount = points[i].element.$context.raw.y;
                let matchedAccData = accFinalData.filter(item => {return item.Month__c == month && item.Amount__c == amount});

		//run a loop for the clicked data that has matched the records in the Account List.
                for(let j=0; j<matchedAccData.length;j++){
	                //push those selected records in an array.
                        matchedIds.push(matchedAccData[j].Id);
                    }
            }
        matchedIds = matchedIds.filter(function(item, pos) {
            return matchedIds.indexOf(item) == pos;
        });

        //run a loop in an array to open final records in a new tab
        for(var k=0;k<matchedIds.length;k++){
            window.open('/' + matchedIds[k],'_blank');
        }

    };
    </script>

</body>
</html>

</apex:page>
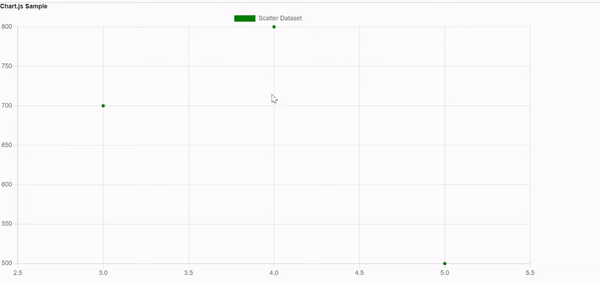
Result:
Summary or Closing Remarks
By implementing the provided code, clicking on points/dots in the scatter chart on the VF Page will dynamically open the record page in a new tab.
If you have any questions you can reach out our Salesforce Consulting team here.