In today’s Data Science era, emphasis on data visualization holds immense significance. Visual representations significantly impact the user interface. However, building custom, responsive, and interactive charts and graphs within Salesforce presents a challenge. Open source solutions serve as prime options for addressing this need. ChartJS stands out as an open source tool that empowers the creation of fully responsive, accessible, and interactive charts and graphs, ensuring optimal performance. Leveraging ChartJS in Salesforce enables the creation of tailored charts and graphs.
In this blog, we’ll explore harnessing the capabilities of ChartJS to construct a responsive Bar chart within a Lightning Web Component (LWC). We’ll delve into extracting information from an Opportunity and integrating it into the bar chart.
What are the benefits of utilizing ChartJS
Charts can be integrated into pages via the App Builder’s “Standard Report Chart” component. Yet, while report filters suffice for showcasing pertinent data on charts, limitations arise when extensive custom logic and filters are required within a Lightning component. The “Standard Report Chart” exhibits limitations in handling filters under these circumstances. ChartJS serves as a practical solution for this issue. Let’s explore this further through an example.
Illustration:
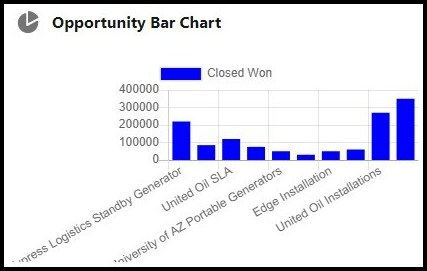
In this example, we’ll create a bar chart illustrating the amounts of the ten most recent Opportunities in the “Closed Won” stage.
Step 1: Obtain the ChartJs library by downloading it.
- Click Here To access the link, right-click on the page and select “Save As” to download the file.
- Upload the file into Static Resources named ‘ChartJS’.
Step 2: Generate a Lightning Web Component named ‘chart’.
<template>
    <div class="slds-p-around_small slds-grid slds-grid--vertical-align-center slds-grid--align-center">
        <canvas class="barChart" lwc:dom="manual"></canvas>
        <div if:false={isChartJsInitialized} class="slds-col--padded slds-size--1-of-1">
            <lightning-spinner alternative-text="Loading" size="medium" variant={loaderVariant}></lightning-spinner>
        </div>
    </div>
</template>
The HTML includes a canvas tag, which the ChartJS library utilizes to render the chart.
import {LightningElement, api, track} from 'lwc';
import chartjs from '@salesforce/resourceUrl/ChartJs';
import {loadScript} from 'lightning/platformResourceLoader';
import {ShowToastEvent} from 'lightning/platformShowToastEvent';

export default class Chart extends LightningElement {
 @api loaderVariant = 'base';
 @api chartConfig;

 @track isChartJsInitialized;
 renderedCallback() {
  if (this.isChartJsInitialized) {
   return;
  }
  // load static resources.
  Promise.all([loadScript(this, chartjs)])
   .then(() => {
    this.isChartJsInitialized = true;
    const ctx = this.template.querySelector('canvas.barChart').getContext('2d');
    this.chart = new window.Chart(ctx, JSON.parse(JSON.stringify(this.chartConfig)));
    this.chart.canvas.parentNode.style.height = 'auto';
    this.chart.canvas.parentNode.style.width = '100%';
   })
   .catch(error => {
    this.dispatchEvent(
     new ShowToastEvent({
      title: 'Error loading ChartJS',
      message: error.message,
      variant: 'error',
     })
    );
   });
 }
}
Within the chart component, we’ve defined two @api attributes:
- loaderVariant: It sets the loader variant from the parent component.
- chartConfig: This attribute allows passing chart settings and data from the parent component, enabling reuse of this component for various charts.
<?xml version="1.0" encoding="UTF-8"?>
<LightningComponentBundle xmlns="http://soap.sforce.com/2006/04/metadata">
    <apiVersion>55.0</apiVersion>
    <isExposed>true</isExposed>
    <targets>
        <target>lightning__AppPage</target>
        <target>lightning__RecordPage</target>
        <target>lightning__HomePage</target>
        <target>lightningCommunity__Page</target>
    </targets>
</LightningComponentBundle>
Step 3: Develop an Apex class to retrieve Opportunity data.
public class OpportunityChartController {
    @AuraEnabled(cacheable=true)
    public static List<Opportunity> getOpportunities(){
        return [SELECT Amount,Name,StageName FROM Opportunity WHERE StageName = 'Closed Won' ORDER BY CreatedDate ASC LIMIT 10];
    }
}
Obtaining data from Opportunities.
Step 4: Generate a parent Lightning Web Component titled ‘barChartExample’.
<template>
    <lightning-card title="Opportunity Bar Chart" icon-name="utility:chart">
        <template if:true={chartConfiguration}>
            <c-chart chart-config={chartConfiguration}></c-chart>
        </template>
    </lightning-card>
</template>
Invoking the child component ‘chart’ and configuring the chart settings.
import {LightningElement, wire, track} from 'lwc';
import getOpportunities from '@salesforce/apex/OpportunityChartController.getOpportunities';

export default class BarChartExample extends LightningElement {
@track chartConfiguration;

@wire(getOpportunities, {})
getOpportunities({error, data}) {
if (error) {
this.error = error;
console.log('error => ' + JSON.stringify(error));
this.chartConfiguration = undefined;
} else if (data) {
let chartData = [];
let chartLabels = [];
data.forEach(opp => {
chartData.push(opp.Amount);
chartLabels.push(opp.Name);
});

this.chartConfiguration = {
type: 'bar',
data: {
    labels: chartLabels,
    datasets: [
    {
    label: 'Closed Won',
    barPercentage: 0.5,
    barThickness: 6,
    maxBarThickness: 8,
    minBarLength: 2,
    backgroundColor: "blue",
    data: chartData,
    },
    ],
},
options: {
},
};
console.log('data => ', data);
this.error = undefined;
}
}
}
The wire method retrieves data from Opportunities and supplies it to the chart Lightning Web Component (LWC).
The crucial element is the chartConfiguration, dictating the chart’s behavior based on the configuration we set for the chart. Here are the main three attributes:
- Type: This defines the type of chart being rendered, such as ‘bar’.
- Data: Here, we include chartLabels, chartData, and other settings for the bar chart.
- Options: These are additional settings for the chart.
<?xml version="1.0" encoding="UTF-8"?>
<LightningComponentBundle xmlns="http://soap.sforce.com/2006/04/metadata">
    <apiVersion>55.0</apiVersion>
    <isExposed>true</isExposed>
    <targets>
        <target>lightning__AppPage</target>
        <target>lightning__RecordPage</target>
        <target>lightning__HomePage</target>
        <target>lightningCommunity__Page</target>
    </targets>
</LightningComponentBundle>
Result: